View SQL Agent queries using OpenAI and Quickchart.io
Generates visual representations from SQL queries utilizing OpenAI and Quickchart.io.
How it works
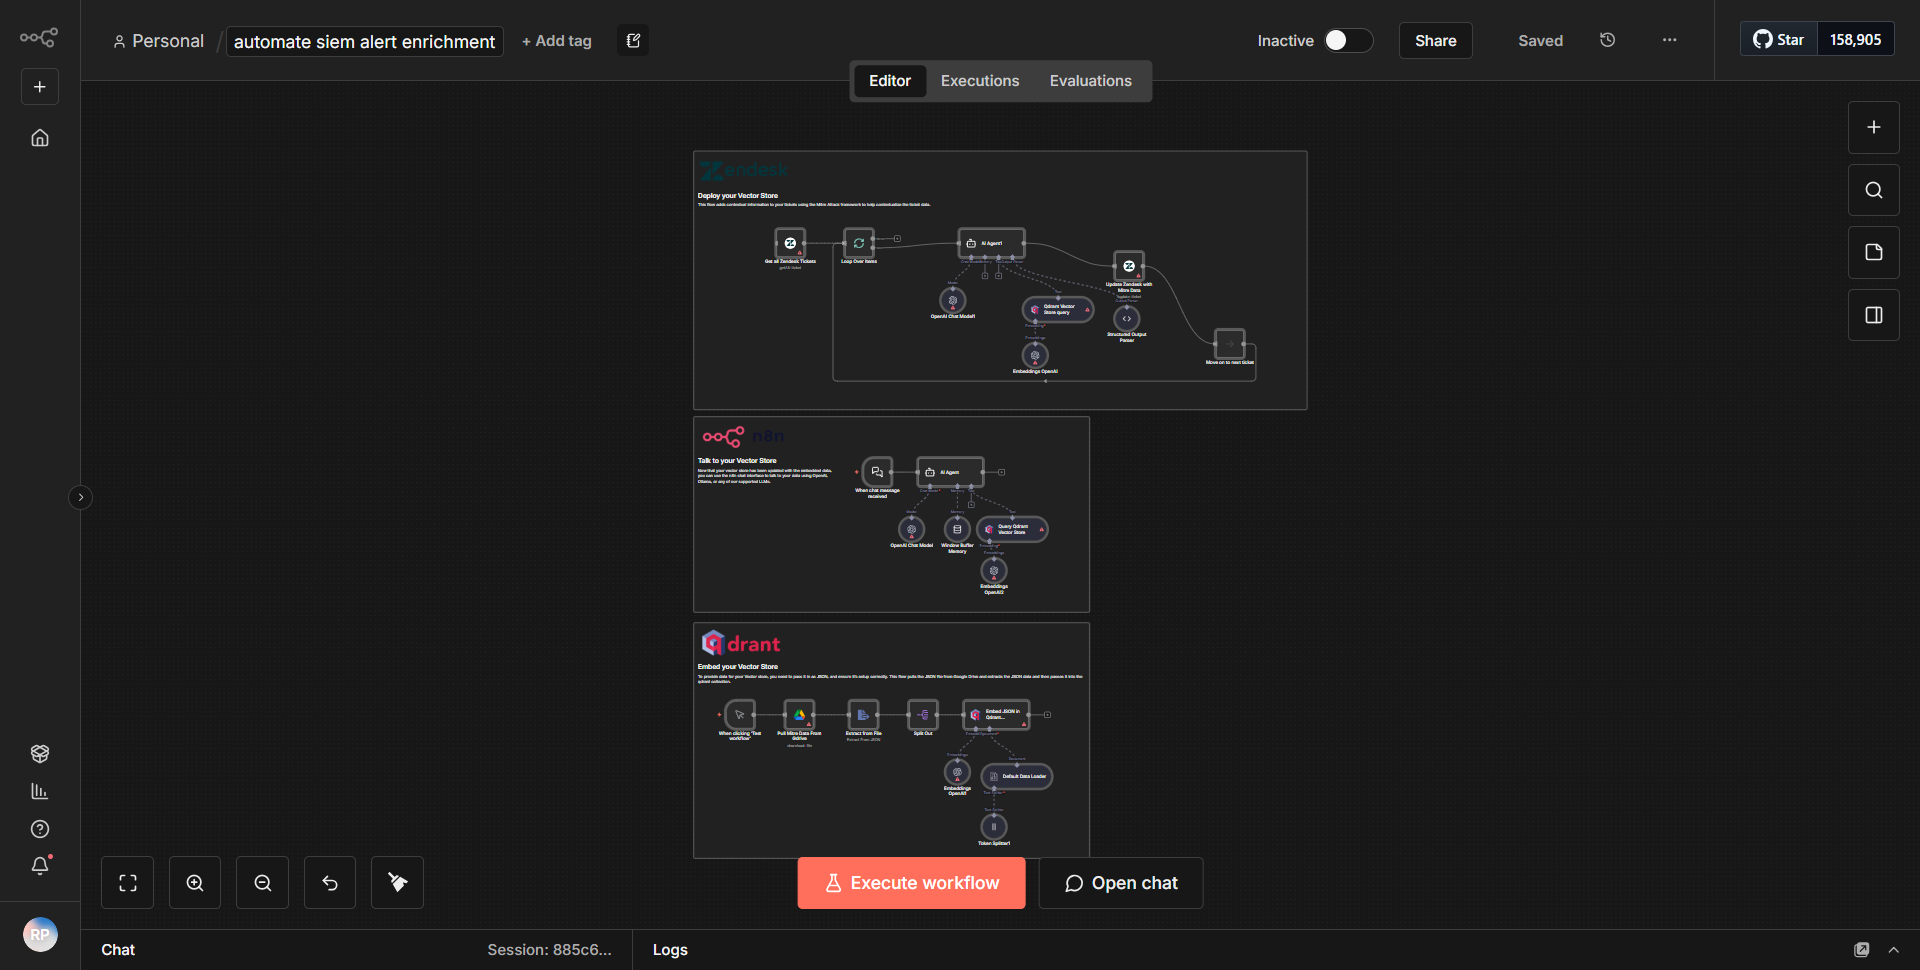
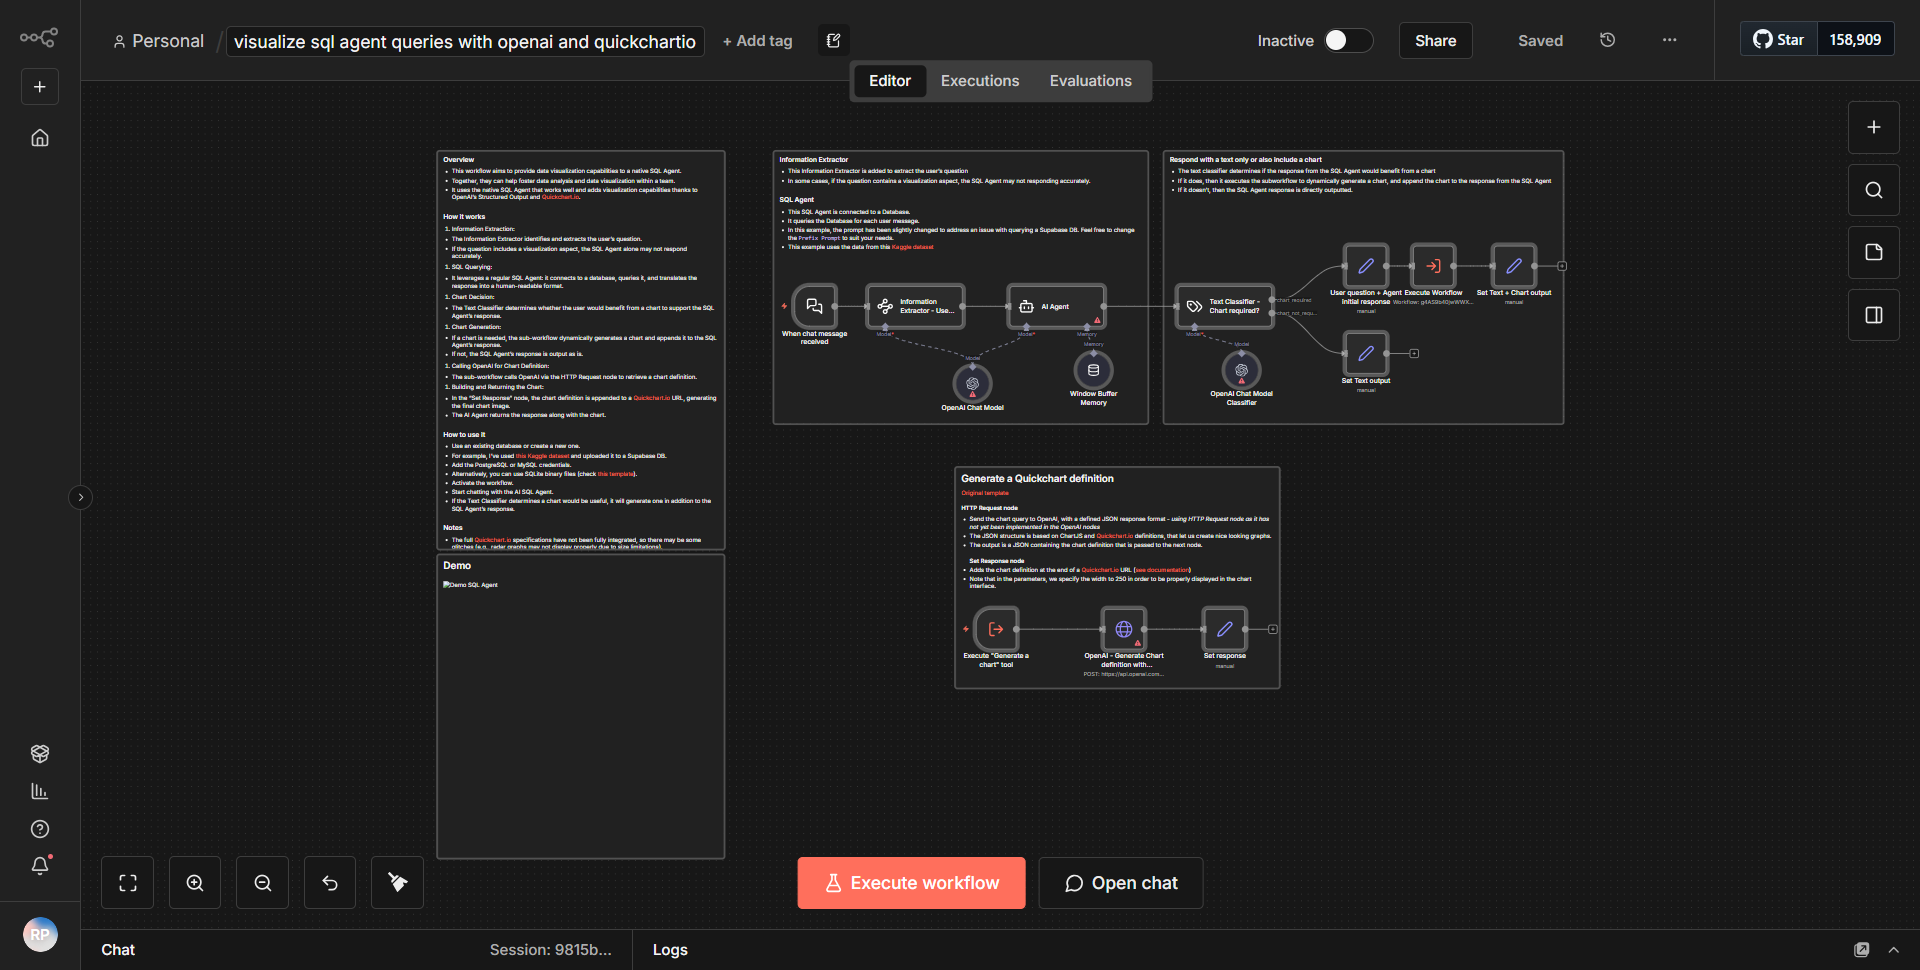
The workflow titled "View SQL Agent queries using OpenAI and Quickchart.io" is designed to generate visual representations of SQL queries by leveraging the capabilities of OpenAI for natural language processing and Quickchart.io for chart generation. The workflow operates through a series of interconnected nodes that facilitate data flow and processing.
1. Trigger Node:
The workflow begins with a trigger node that initiates the process. This could be a manual trigger or an event-based trigger depending on the configuration.
2. SQL Query Node:
The first operational node is responsible for executing a SQL query against a specified database. This node retrieves data that will be analyzed and visualized.
3. OpenAI Node:
After obtaining the SQL query results, the data is passed to the OpenAI node. This node processes the data using OpenAI's API to generate a natural language description or analysis of the SQL query results. The output from this node is a textual representation that summarizes the insights derived from the SQL data.
4. Quickchart.io Node:
The next step involves sending the processed data to the Quickchart.io node. This node takes the output from the OpenAI node and utilizes it to create a visual chart. Quickchart.io generates a chart based on the specifications provided, which can include various types of visualizations such as bar charts, line graphs, etc.
5. Output Node:
Finally, the workflow concludes with an output node that presents the generated chart. This could be in the form of a URL link to the chart image or an embedded visual representation, depending on the configuration of the output node.
Throughout this process, data flows seamlessly from one node to another, with each node performing a specific function that contributes to the overall goal of visualizing SQL query results.
Key Features
- Natural Language Processing:
The integration with OpenAI allows for sophisticated analysis of SQL query results, transforming raw data into comprehensible insights.
- Dynamic Chart Generation:
Quickchart.io provides the capability to create dynamic and customizable charts based on the processed data, enhancing the visual appeal and interpretability of the results.
- Automated Workflow:
The entire process is automated, allowing users to generate visual representations of SQL queries without manual intervention, saving time and reducing errors.
- Versatile Output Options:
The workflow can be configured to output various types of visualizations, catering to different user needs and preferences.
- Integration with SQL Databases:
The ability to execute SQL queries directly from the workflow makes it highly useful for data analysts and developers who need to visualize database information quickly.
Tools Integration
- OpenAI:
Utilized for processing and generating natural language descriptions from SQL query results.
- Quickchart.io:
Employed for creating visual representations of the data, allowing users to generate charts and graphs easily.
- n8n SQL Node:
This node is used to execute SQL queries against a database, retrieving the necessary data for analysis.
- n8n HTTP Request Node:
This node is likely used to interact with the OpenAI and Quickchart.io APIs, sending requests and receiving responses.
API Keys Required
- OpenAI API Key:
Required for authenticating requests to the OpenAI service to process SQL query results.
- Quickchart.io API Key:
Necessary for generating charts through the Quickchart.io service, ensuring that the requests are authorized.
- Database Credentials:
Depending on the SQL node configuration, credentials for accessing the database may also be required, including username, password, and database name.
This workflow effectively combines the power of AI and data visualization tools to enhance the analysis of SQL queries, making it a valuable asset for data-driven decision-making.