PDF Charts
Graphs for developers on the go!
On
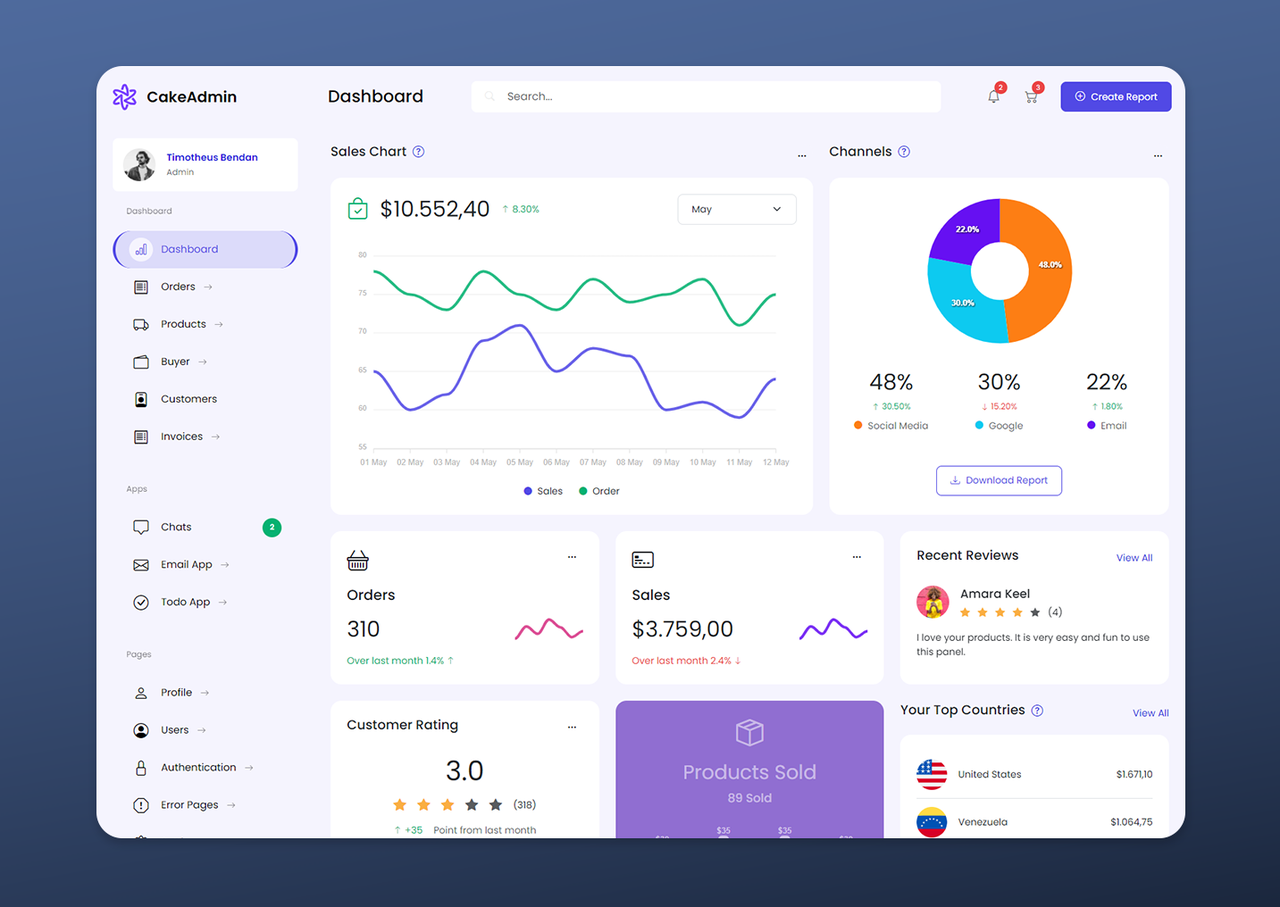
PDF Charts is a powerful tool designed to simplify the creation of dynamic charts, allowing developers to generate visually appealing graphics swiftly and efficiently. With an intuitive drag-and-drop interface, users can easily customize chart elements without needing extensive coding knowledge. The platform supports various chart types, including bar, line, and pie charts, catering to diverse data visualization needs. Additionally, the integration of an API enables seamless generation of PDF documents containing the charts, making it ideal for applications that require automated reporting or data presentation. Moreover, PDF Charts is enhanced by an AI-driven guide that assists users throughout the chart creation process, ensuring a smooth and user-friendly experience. This feature not only helps in crafting charts but also optimizes the design to meet professional standards, enhancing the overall quality of the output. The tool prioritizes flexibility and usability, allowing developers to integrate it into their projects easily, whether they are creating dashboards, reports, or interactive applications. The combination of these features positions PDF Charts as a comprehensive solution for anyone looking to produce high-quality charts efficiently.